Excel Based Trading Algorithm
Disclaimer : I am not a Financial Advisor and I am not advocating the trading algorithm below. This is an example.
This post is meant to demonstrate some of the math and decisions required to write an Algorithmic Trading app. It is a follow up to a previous article published. As explained earlier, these systems monitor a set of market indicators for a particular asset class and security to buy/sell then exit those positions based on those indicators. They take the emotion out of trading, and that is a good thing. However, since they monitor a small subset of the market context for a given security, they can underperform. See the details below for more information.
Core Topics
1. Review of trading strategy
2. Do not reinvent the wheel
3. The Data Requirements
4. Back Testing and Results - Understanding when the strategy is most beneficial
Review of the trading strategy
Indicators Used -
EMA 9, 50 and 200 – The Exponential Moving Average of the closing price based on the last 9, 50 or 200 candles is used. The ‘exponential’ prefix indicates that the most recent price in the candle is given more weight. Again, a candle can be any amount of time, but in this example we are using daily prices.
Stoch RSI is an abbreviation for Stochastic Relative Strength Indicator and it ranges from zero to 1. I won’t go into the math, but the key is that it helps identify overbought and oversold situations. Our rule indicates that an RSI indicator below .30 is signaling an oversold condition. The K line is the fast moving RSI moving average (usually < 3 candles) and the D line is the slow moving average (> 3 candles).
The strategy we are using will employ the following rules.
- EMA 9 is higher than EMA 50 and EMA 50 is higher than EMA 200
- STOCH RSI is below 30 trending and STOCH line K cross above D
- Entry price: close of previous candle (previous day)
- Exit price when STOCH RSI line K crosses below D
Do not reinvent the wheel
All of the formulas were available on Investopedia or by doing a Google search for the formula. In some cases, I literally copied the Excel formulas and did not even need to write them. I spent about 4 hours developing the spreadsheet.
The Data Requirements
The strategy that was implemented used 1 day price snapshots, which included the Open, High, Low and Close for the day (which is a minimal set of requirements). The historical data goes back almost three 3 years but I only ran the strategy for the past 2 years of daily snapshots. This level of daily historical data is available from Yahoo Finance or many other finance websites.
Back Testing And Results - Understanding when the strategy is most beneficial
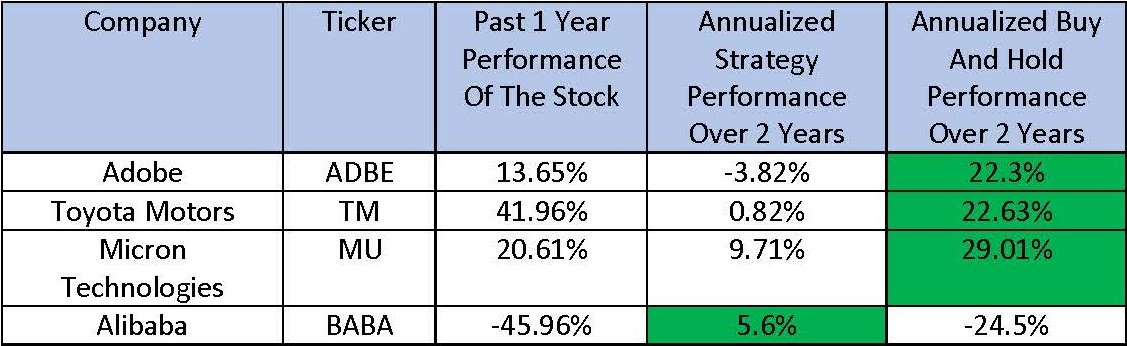
When running the simulations on historical data, I compared the results against just a buy and hold approach for 4 mid-large cap common stocks. The algorithm did not use leverage (ie. use short positions, options or futures) and only bought and sold 1 share at a time. The results below do not incorporate taxes or commissions. It should be noted that the buys and sells with the algorithm will generate taxable events where the buy and hold approach will not generate taxable events until the position is closed.
This is a limited sample so no definite conclusions can be drawn. It is interesting to see that the algorithm doesn’t exceed a simple ‘Buy and Hold’ approach with the bull market scenarios (again, a limited sample size). The algorithm outperformed the ‘Buy and Hold’ approach on the one bearish scenario. The actual Excel files can be found here.